XGBoostExplainerが何をやっているか調べる(1.とりあえず使う)
目的
XGBoostの予測を分解するツールXGBoostExplainerは、あるインスタンスについて得られたXGBoostによる予測結果が、どのように構成されているか可視化してくれる。

コンセプトとしては、randomforestにおけるforestfloorと同じく、feature contributionを算出する。ターゲット集団の変数の感度分析に使うのではなく*1、個々のインスタンスのxgboostによる予測結果の説明をWaterfall Chartで可視化してくれるのが特徴。
なお、同様のWaterfall Chartによる説明は、そのほかの手法についても提供されているようだ。
lightgbmの予測結果に適用してくれるパッケージ
lm/glmの予測結果に適用してくれるパッケージ
探索的なデータ分析に使うだけならおおむね問題ないと思うが、具体的に何をやっているか説明しようとして困った。論文などの詳細な資料も見つけられなかったため、XGBoostExplainerの実装を追いかけて、何をやっているか調べた。
関連シリーズ
- とりあえず使ってみる
- 予測結果の可視化プロセスをstep-by-stepで実行する(この記事)
- 予測結果を分解再構成するプロセスをstep-by-stepで実行する
- 学習したxgboostのルール抽出をstep-by-stepで実行する
参考
開発元の紹介記事
とりあえず使ってみる
すでに日本語の記事がある。
xgboostExplainerのマニュアルにあるexampleからコピペを眺める。
インストール
本家の記事に従ってgithubからインストール
install.packages("devtools")
library(devtools)
install_github("AppliedDataSciencePartners/xgboostExplainer")
XGBモデルの学習と予測
今回はxgboostパッケージ付属のサンプルデータで、定番の食えるキノコと毒キノコの2値分類。細かいチューニングは、必要に応じてautoxgbあたりでチューニングするとよいが、今回は省略。
library(xgboost)
require(tidyverse)
library(xgboost)
library(xgboostExplainer)

set.seed(123)

data(agaricus.train, package='xgboost')

X = as.matrix(agaricus.train$data)
y = agaricus.train$label
table(y)
train_idx = 1:5000

train.data = X[train_idx,]
test.data = X[-train_idx,]

xgb.train.data <- xgb.DMatrix(train.data, label = y[train_idx])
xgb.test.data <- xgb.DMatrix(test.data)

param <- list(objective = "binary:logistic")
xgb.model <- xgboost(param =param,  data = xgb.train.data, nrounds=3)
#
# col_names = colnames(X)
#
# pred.train = predict(xgb.model,X)
# nodes.train = predict(xgb.model,X,predleaf =TRUE)
# trees = xgb.model.dt.tree(col_names, model = xgb.model)
個別の予測結果の可視化
xgboostExplainerのマニュアルにあるexampleのコピペ(つづき)。高度にwrapされているためわずか3行でstep-by-stepが完了する。
STEP.1. 学習済みXGBモデルからルールセット(leafまでのパス)を列挙してテーブル化
base_scoreオプションはxgboostのオプションそのままで、ターゲット集団のクラス不均衡を表す事前確率。すなわち正例:負例=300:700を仮定できる対象であれば、base_score = 0.3となる(デフォルトは1:1を表す0.5)。
library(xgboostExplainer)

explainer = buildExplainer(xgb.model,xgb.train.data, type="binary", base_score = 0.5, trees = NULL)
#>
#> Creating the trees of the xgboost model...
#> Getting the leaf nodes for the training set observations...
#> Building the Explainer...
#> STEP 1 of 2
#>
#> Recalculating the cover for each non-leaf...
#>
  |=================================================================| 100%
#>
#> Finding the stats for the xgboost trees...
#>
  |=================================================================| 100%
#>
#> STEP 2 of 2
#>
#> Getting breakdown for each leaf of each tree...
#>
  |=================================================================| 100%
#>
#> DONE!
STEP.2. Get multiple prediction breakdowns from a trained xgboost model
マニュアルには step2とあるのだが、実はパッケージを使うだけならスキップできてしまう。
STEP.3. 予測対象(インスタンス)に適用される各treeのパスを集計して可視化
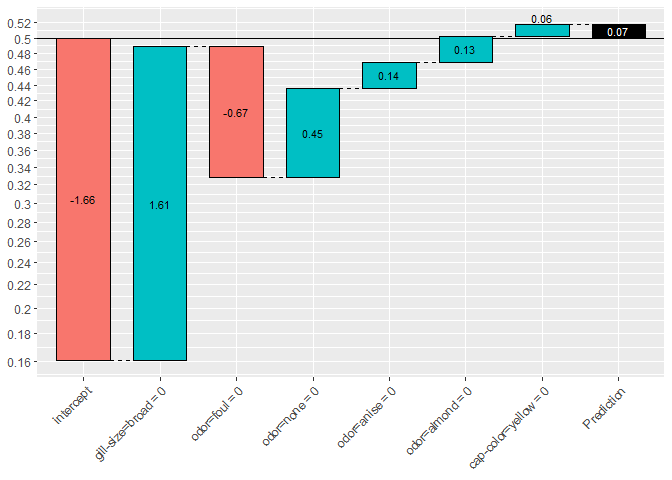
2値分類(binary:logistic)では、片側のクラスに属する確率p(左軸の数値)のロジット(対数オッズ;棒グラフ中の数値)が足し合わされている様子を表示する。
showWaterfall(xgb.model, explainer, xgb.test.data, test.data,  2, type = "binary")
#>
#>
#> Extracting the breakdown of each prediction...
#>
 |=================================================================| 100%
#>
#> DONE!
#>
#> Prediction:  0.811208
#> Weight:  1.457879
#> Breakdown
#>        intercept  gill-size=broad        odor=foul        odor=none
#>      -0.27084657       1.61423045      -0.67129347       0.45408751
#>       odor=anise      odor=almond cap-color=yellow
#>       0.13628094       0.13073006       0.06468987

(参考) binary:logisticの場合、base_scoreで設定した事前確率は ベースラインとしてinterceptに反映される。下記の例ではinterceptだけが下がっていることに注目されたい。
explainer = buildExplainer(xgb.model,xgb.train.data, type="binary", base_score = 0.2, trees = NULL)
showWaterfall(xgb.model, explainer, xgb.test.data, test.data,  2, type = "binary")
#>
#>
#> Extracting the breakdown of each prediction...
#>
  |=================================================================| 100%
#>
#> DONE!
#>
#> Prediction:  0.5178885
#> Weight:  0.07158444
#> Breakdown
#>        intercept  gill-size=broad        odor=foul        odor=none
#>      -1.65714093       1.61423045      -0.67129347       0.45408751
#>       odor=anise      odor=almond cap-color=yellow
#>       0.13628094       0.13073006       0.06468987

次回は、xgboostExplainerにより、xgboostのモデルと予測結果から何が取り出され、どう捌かれているかだけを詳細に見ていく。
*1:XGBoostExplainerの開発者による記事では、感度分析も行っている